California public transit by the numbers
The California Transit Association, in partnership with OpenGov, is pleased to provide this interactive database displaying details on operating statistics and financial information regarding public transit in California. The tool utilizes data from State Controller’s Office reports dating back to 2003.
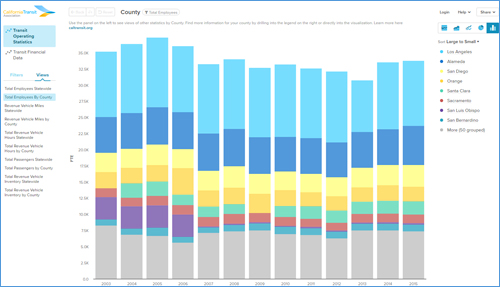
Click the image to enter the database, or click the buttons below to go directly to specific reports.


How to find the data you want to see
OpenGov allows you to explore budget and historical finances in a simple graphical user interface. Here are some basic tips for exploring the database.
- At the top of the left column, select what type of data you wish to view (Operating Statistics or Financial Data).
- Click on Views on the left-hand side to see a list of common or favorite views on each report.
- Click on Filters to select exactly which data you want to include, or exclude, from your graph or chart.
- Use the Fiscal Year slider bar at the bottom of the Filters list to specify the time period for the data you wish to view.
- Use the image icons at the top right to specify what type of graph you wish to view (pie chart, bar graph, etc.).
- Clicking on a graph will drill down a layer into the data. For example, when viewing a graph of data by county, click the portion of the graph for a specific county to see the data broken down by transit systems within that county.
- Below any chart or graph, you can view a Table detailing the financial information in the visualization above.
- Click the Share button at the top right for options to share your graph via social media, or to download the data as an image or a spreadsheet.
For more tips, click the Help button located at the top right of any screen within the database.